By David Strachan - Associate VP, Software Engineering at HCL Software
Results from the first large-scale AIMM assessment across a global engineering organisation.
Earlier this year I wrote about the AI Engineering Maturity Model — a five-level framework for understanding how engineers actually work with AI, from ad-hoc chatbot use all the way through to bounded autonomous workflows. This post is the first set of results.
We all feel that the use of AI in software engineering will be transformative, and there are a lot of enthusiastic evangelists around. Going behind the hype reveals a much more mixed picture of adoption. My goal was to get behind the great anecdotes and get an honest, org-wide picture of how engineers are really using these new tools.
For those who haven’t seen the original post: the AIMM is a five-level maturity scale scored from 1.0 to 4.0.
L1 (Explorer) is where engineers are experimenting individually with AI tools.
L2 (Tool Adopter) is active, habitual use — IDE plugins installed, regular AI interaction — but practice is still individual.
L3 (Prompt Engineer) reflects structured, intentional prompting and early workflow integration.
L4 (System Designer) means AI is embedded into engineering systems and team standards.
L5 (Autonomous Orchestrator) covers bounded autonomous AI workflows.
The assessment covers 25 questions across five dimensions — Intent & Requirements, Development Workflow, Architecture & Context, Verification & Quality, and Scale & Integration — and takes around 15 minutes to complete. Each question maps to a specific capability within the scale, giving a dimension-by-dimension breakdown alongside an overall score.
From March to May 2026, we ran the assessment across the organisation I work in: 1,309 engineers across 32 teams in 11 countries, with the majority in India and the United States and the remainder across Europe and Asia-Pacific. The organisational context is one of strong management support for agentic coding, supported by the provision of a range of tools such as Github Copilot, Windsurf/Devin and Claude Code.
L2: Tool Adopter
The organisation overall landed at Level 2: Tool Adopter — a score of 2.08 out of 4.0. This is the band where AI tools are in active use and IDE plugins are installed, but practice is still largely individual rather than institutionalised.
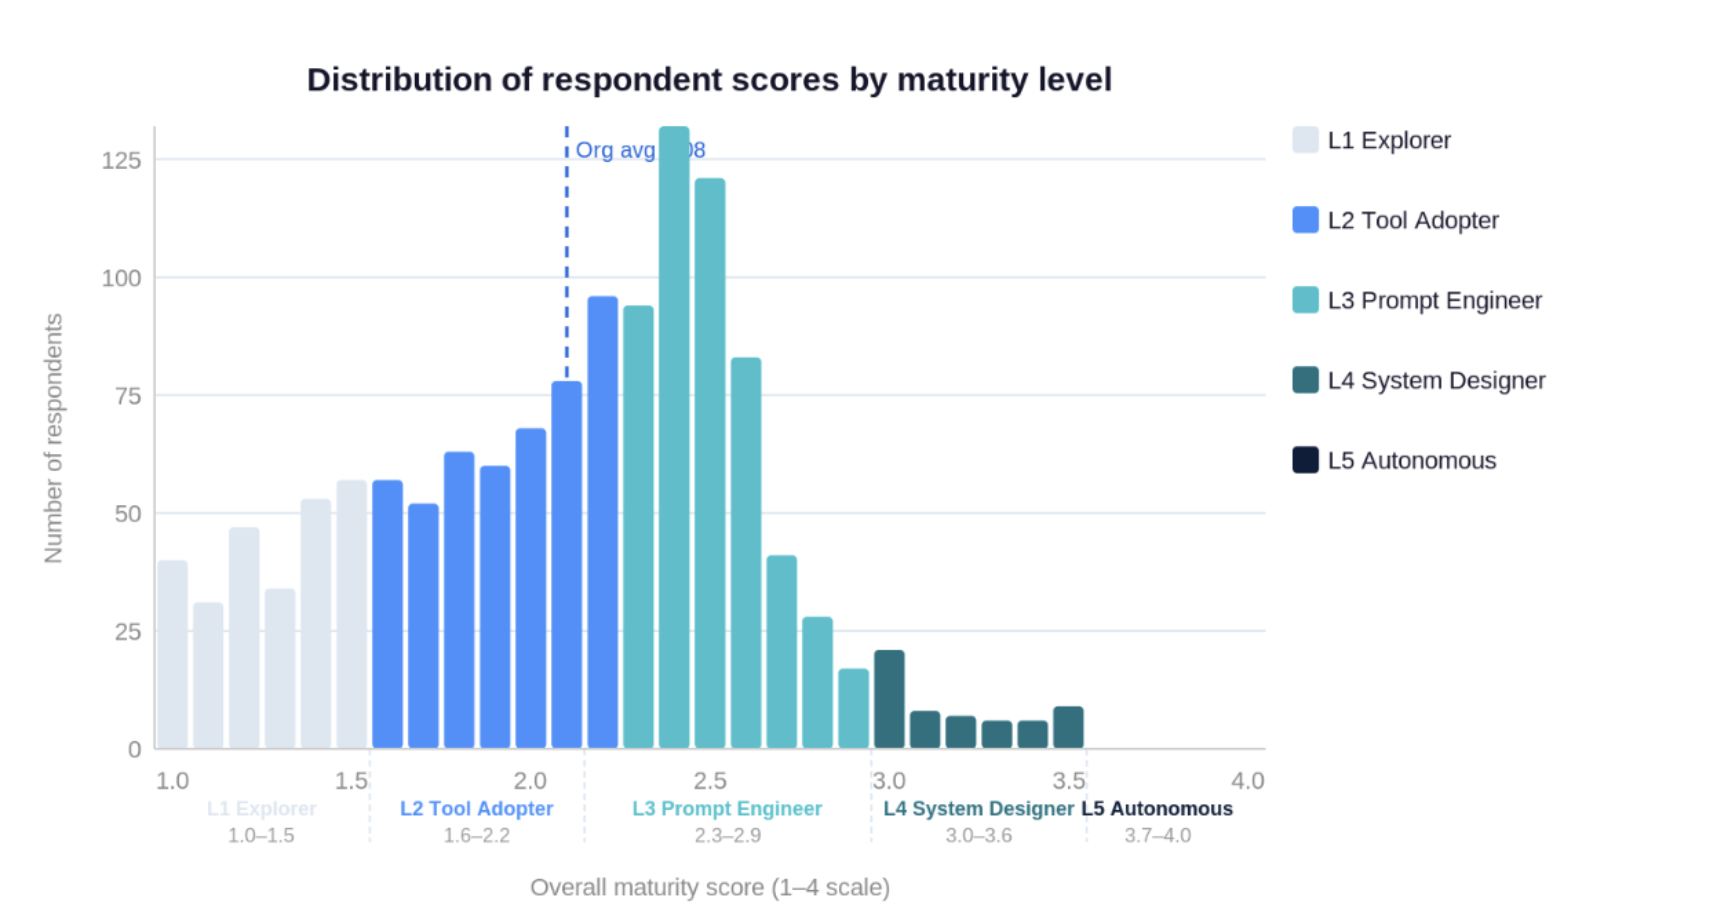
Distribution of individual respondent scores (n=1,309), coloured by maturity level.
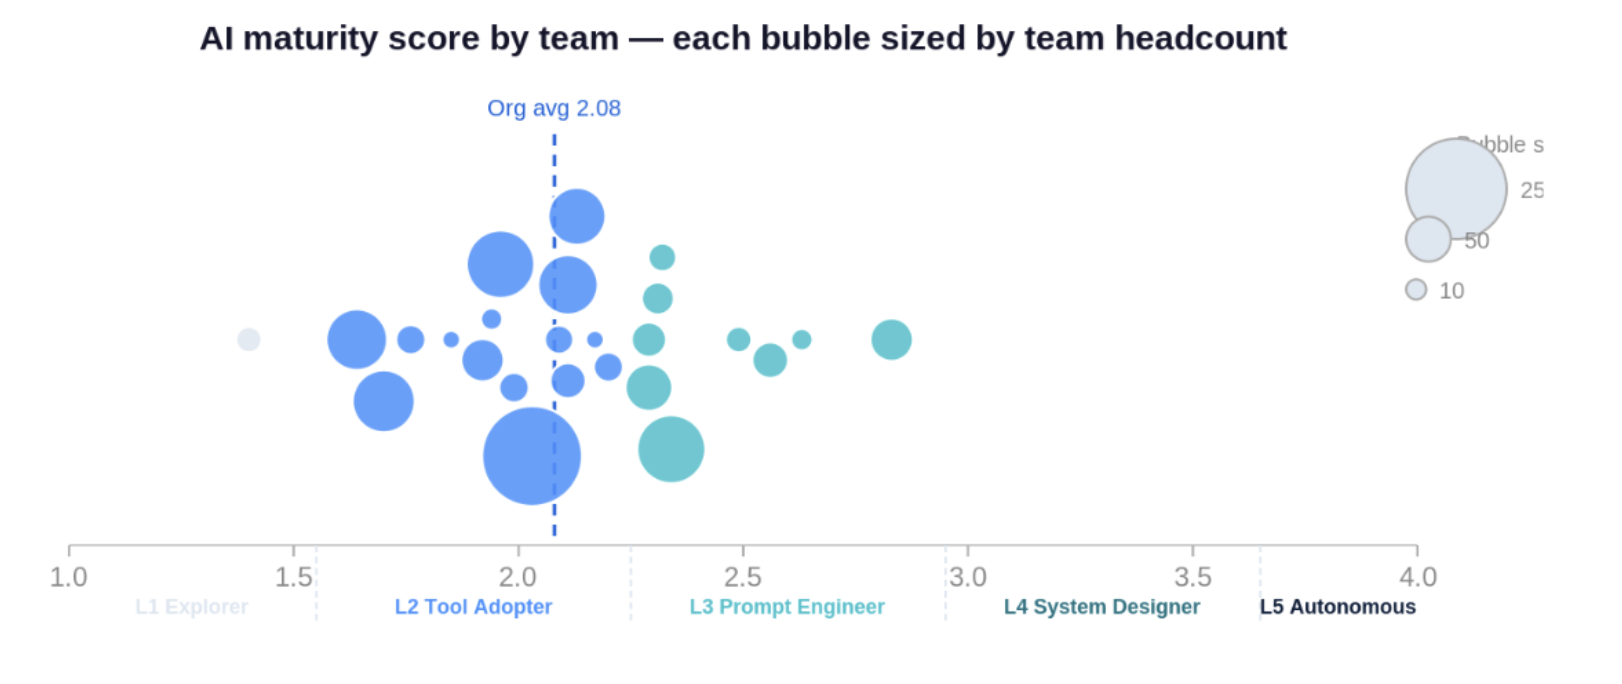
AI maturity score by team, sized by headcount. 25 teams with 5+ respondents; team identities anonymised.
There is wide variation between individuals and between teams. The individual distribution shows respondents already operating in L4 territory within teams whose overall average remains in L2 or L3 — leading practitioners and early-stage adopters often in the same team, reviewing the same code. Larger teams also tend to be less mature than smaller ones.
I have no clear benchmark for how this compares to the broader industry, but a couple of studies suggest we aren’t doing badly. Eficode’s 2026 report 1 and McKinsey’s 2025 State of AI 2 both point to many organisations still in early-stage individual adoption. Those surveys measure organisational strategy rather than individual practice, but the picture is consistent.
The most useful finding in the data: higher levels are already being achieved within the same organisation, with access to the same tools. The lever isn’t technology. It’s structured practice.
The finding that surprised me most: senior engineers score lower
The most striking result was the inverse relationship between seniority and AI maturity.
Junior engineers (P1 band) had a median score of 2.25. Senior engineers (P4 band) had a median of 1.82 — nearly half a level lower. The gradient is clear and consistent across all bands, and the chart shows how it varies across teams at differing stages of maturity.
In the chart, the career levels from P1 to P5 roughly span from graduate hires, through junior and senior engineers to team leads and architects.
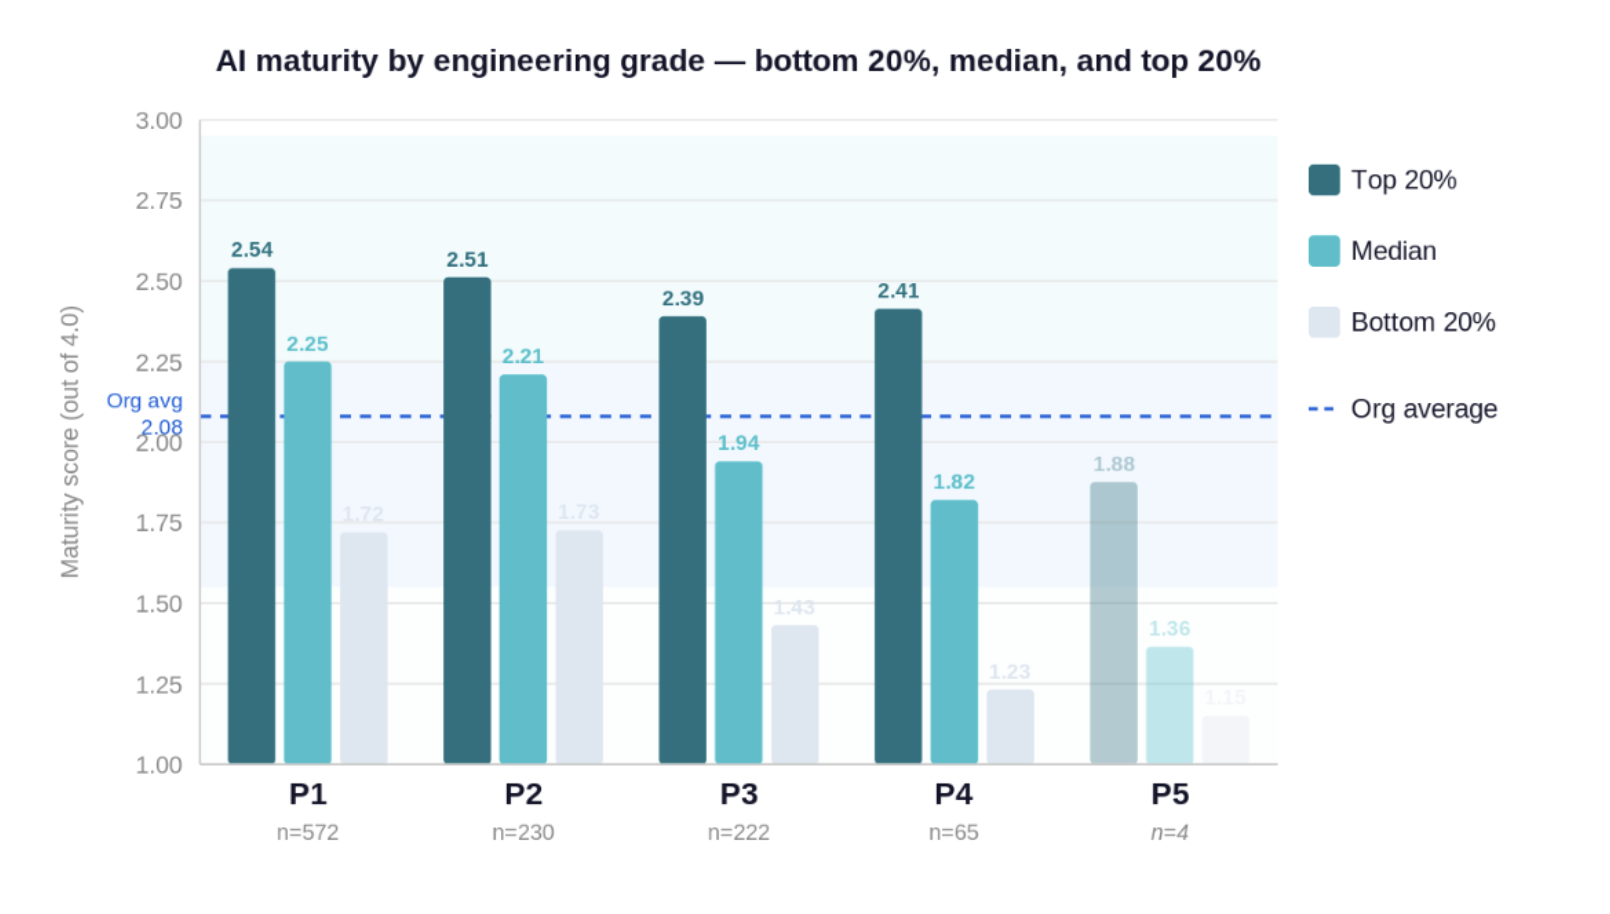
AI maturity by engineering grade — bottom 20%, median, and top 20%. P5 cohort is small (n=4).
There are plausible explanations: more conservative self-assessment, less hands-on coding time, junior engineers overestimating their fluency. Probably all three are true to some degree.
In the top third of teams by overall maturity, P1 engineers averaged 2.53 versus 1.98 in the bottom third. The gradient persists but compresses significantly in higher-performing teams — the gap between most and least senior bands narrows to under 0.1 points at the top versus nearly 0.3 in the bottom third.
It’s not clear whether the engagement of more senior engineers is critical to driving higher maturity, or whether a more mature team brings the senior engineers along with it. My instinct is the first one, and that causal link needs further investigation. Finding out more on this topic will shape our enablement programmes.
What was strongest — and what the question data shows
As noted, the survey spanned five dimensions — Intent & Requirements, Development Workflow, Architecture & Context, Verification & Quality, and Scale & Integration. Overall, all five dimensions landed in Level 2 territory, with scores ranging from 2.02 to 2.15. The chart below compares how the top 20%, median, and bottom 20% of respondents perform across each dimension — and the gap is consistent: top performers are roughly a full level ahead of the bottom across every dimension.
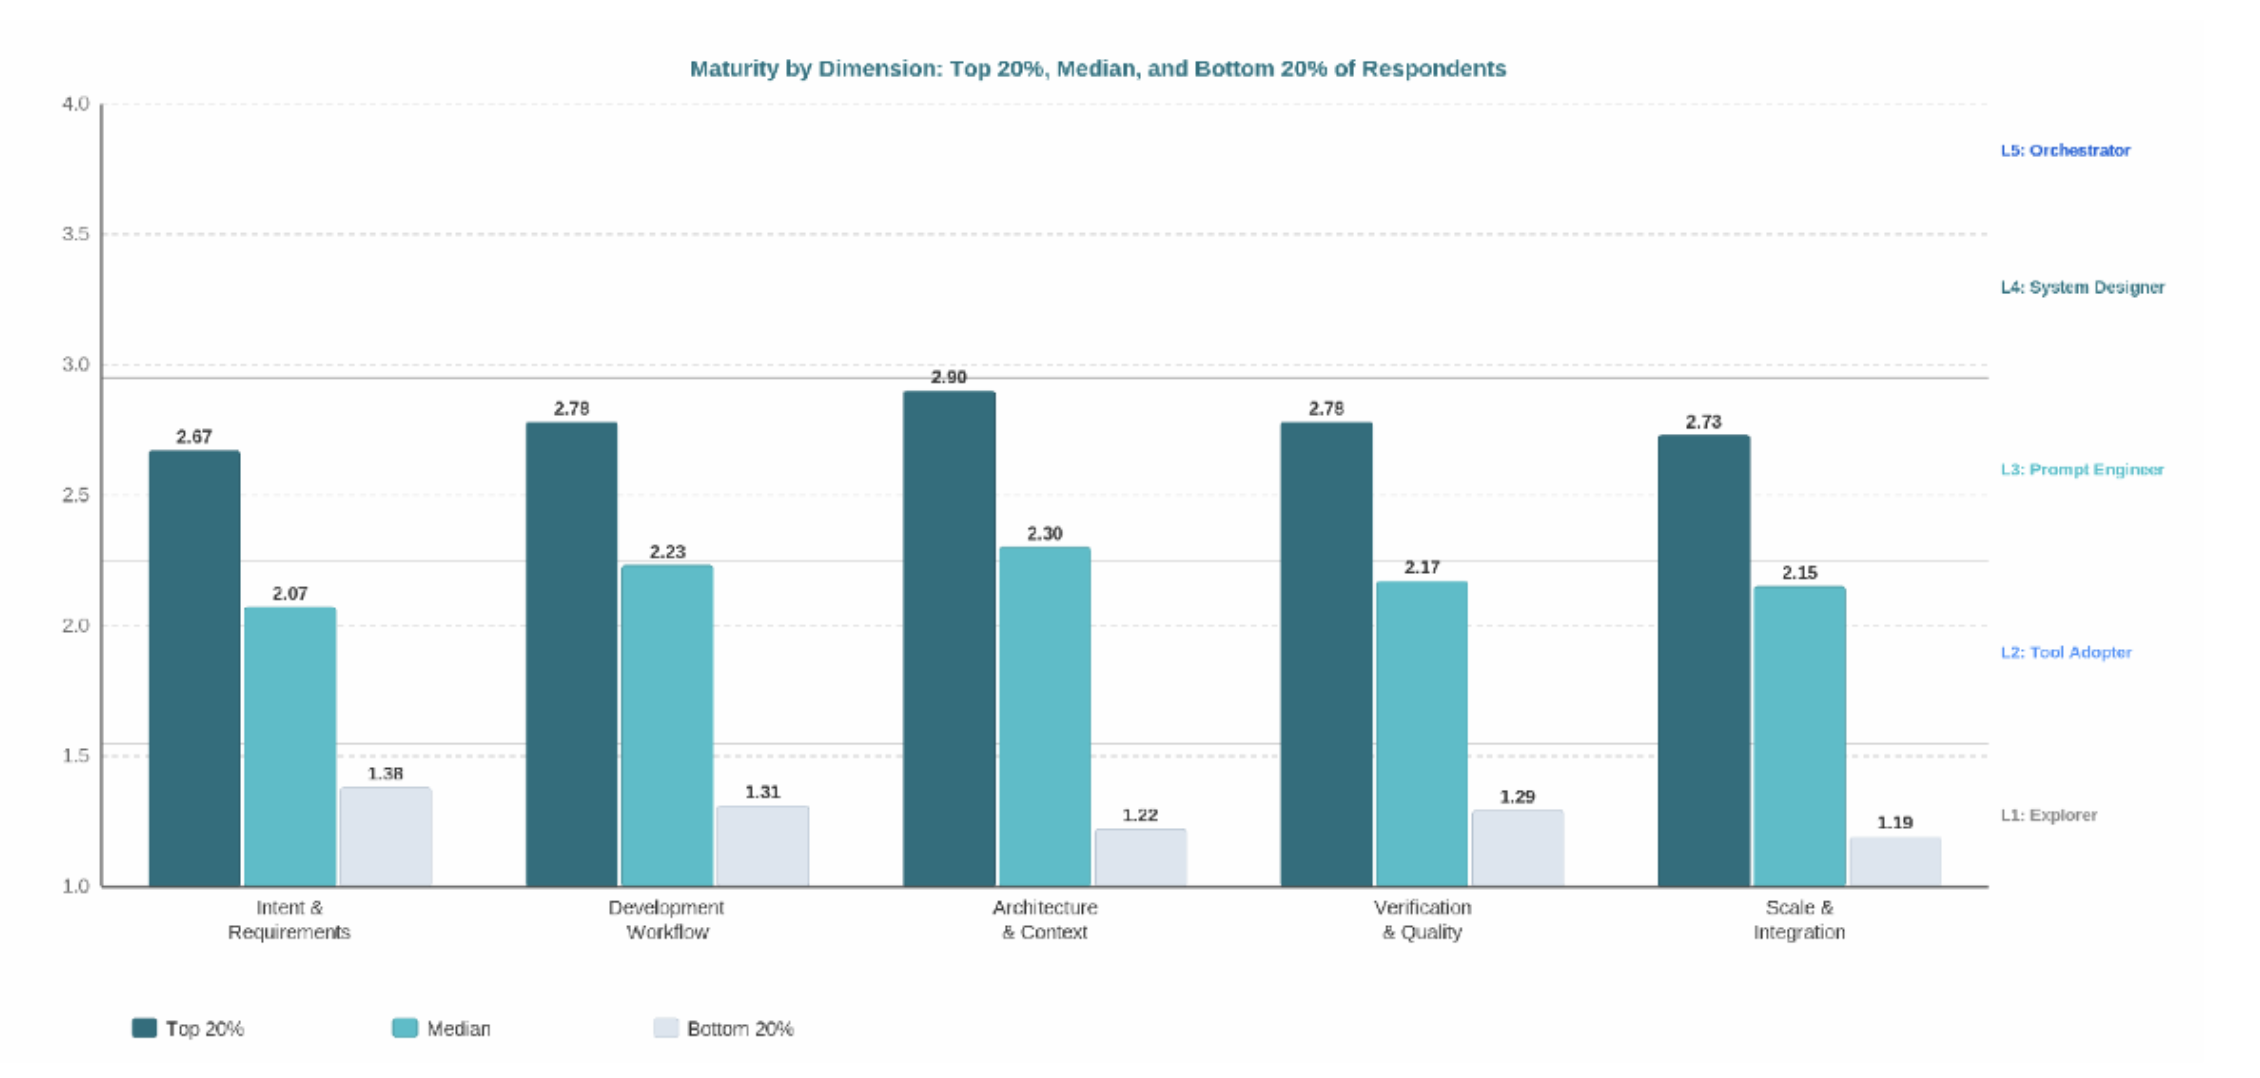
Dimension scores for top 20%, median, and bottom 20% of respondents by overall maturity. Top 20% threshold: 2.52.
The five dimension scores cluster tightly (2.02–2.15), which the statistical analysis confirms is a genuine finding rather than an instrument artefact.*
AI engineering maturity in this cohort behaves largely as a single construct. Engineers who are strong in one dimension tend to be strong across all of them — which is why the dimension scores move together. The implication is that interventions targeting any dimension are likely to lift the others. But it also means that the actionable signal lives at the question level, not the aggregate.
Looking at the question level data all this to life, and shows within each dimension what the gap looks like between teams. Each of the charts below compares a relatively immature team (Team A) with a more mature one (Team B) on the single most informative question for each dimension.
Architecture & Context
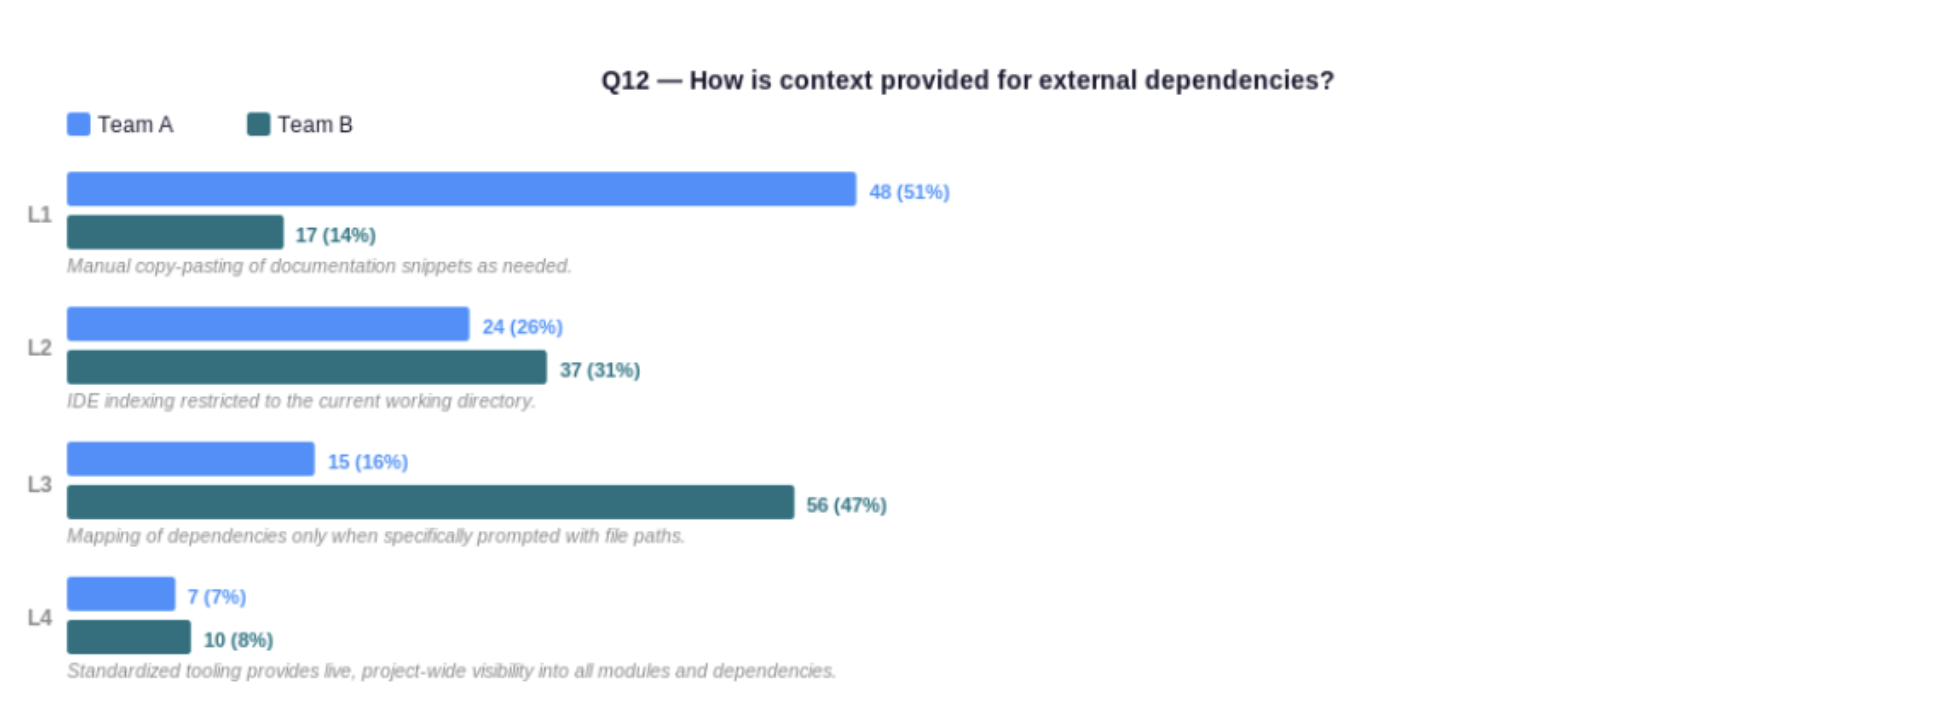
Team A (less mature) vs Team B (more mature). Q12 — How is context provided for external dependencies?
Team A has 51% of engineers manually copy-pasting documentation snippets — the most common approach. Team B has shifted significantly: just 14% remain at L1, while 47% have moved to systematic dependency mapping at L3. Engineers in Team A are generally making conscious tool choices, but context provision is still reactive and per-session. In Team B it has become a standardised workflow. The top 20% of respondents average 2.90 on this dimension.
Development Workflow
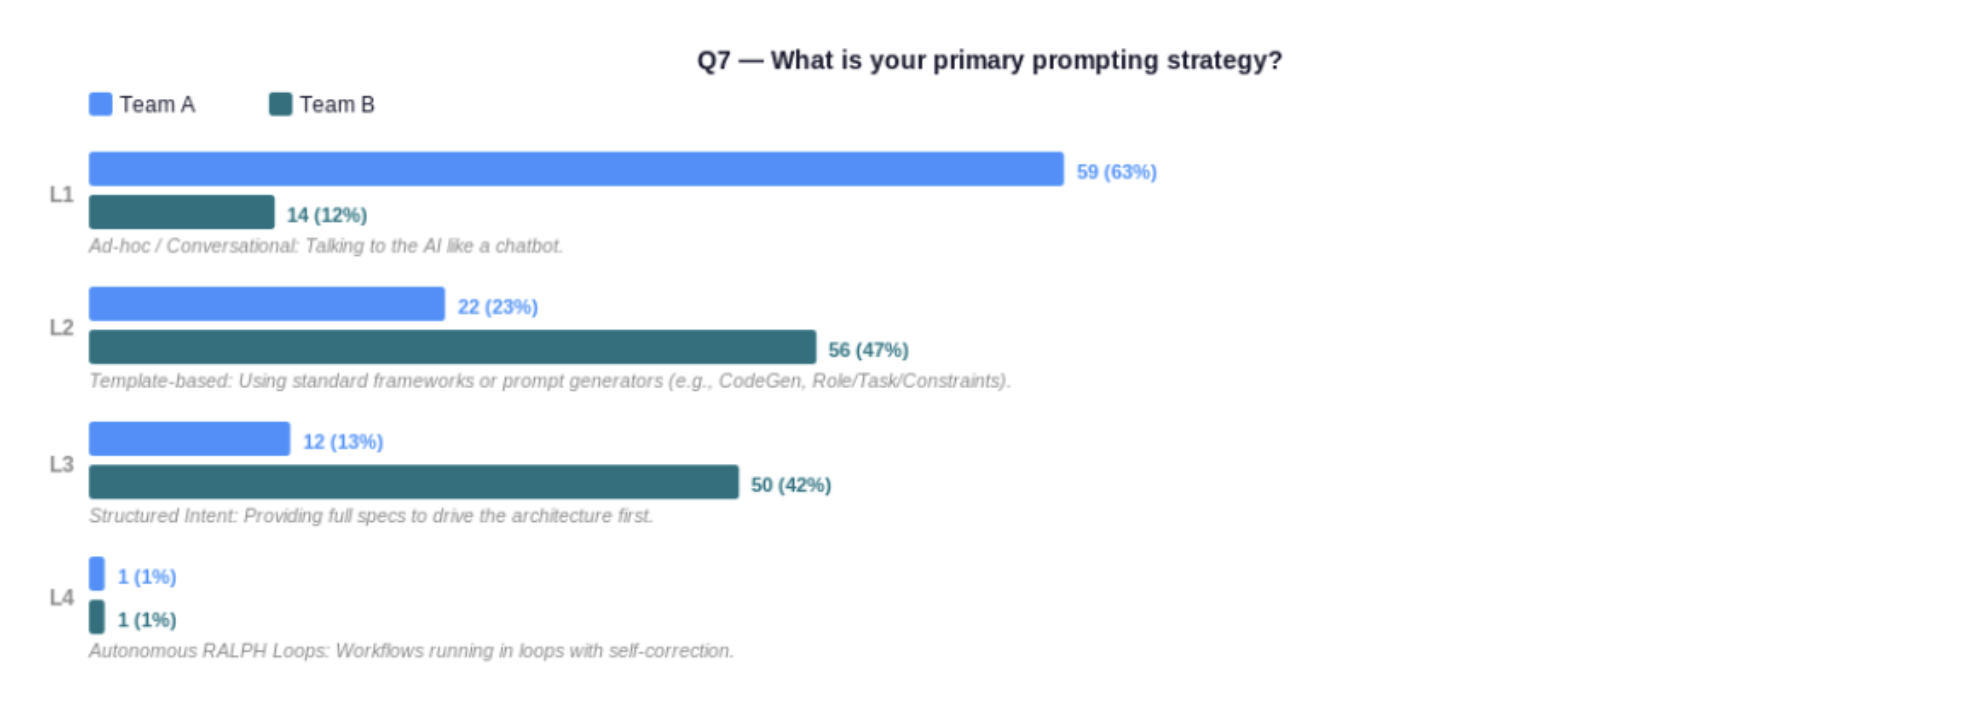
Team A (less mature) vs Team B (more mature). Q7 — What is your primary prompting strategy?
This is the single most predictive question in the assessment (correlation 0.79). In Team A, 63% are prompting ad-hoc — talking to the AI like a chatbot. In Team B, that has fallen to 12%, with 47% using template-based prompting and 42% using structured intent. The gap represents an entire generation of practice: reactive conversation versus deliberate specification. Moving from ad-hoc to structured is the core of the L2→L3 transition.
Verification & Quality
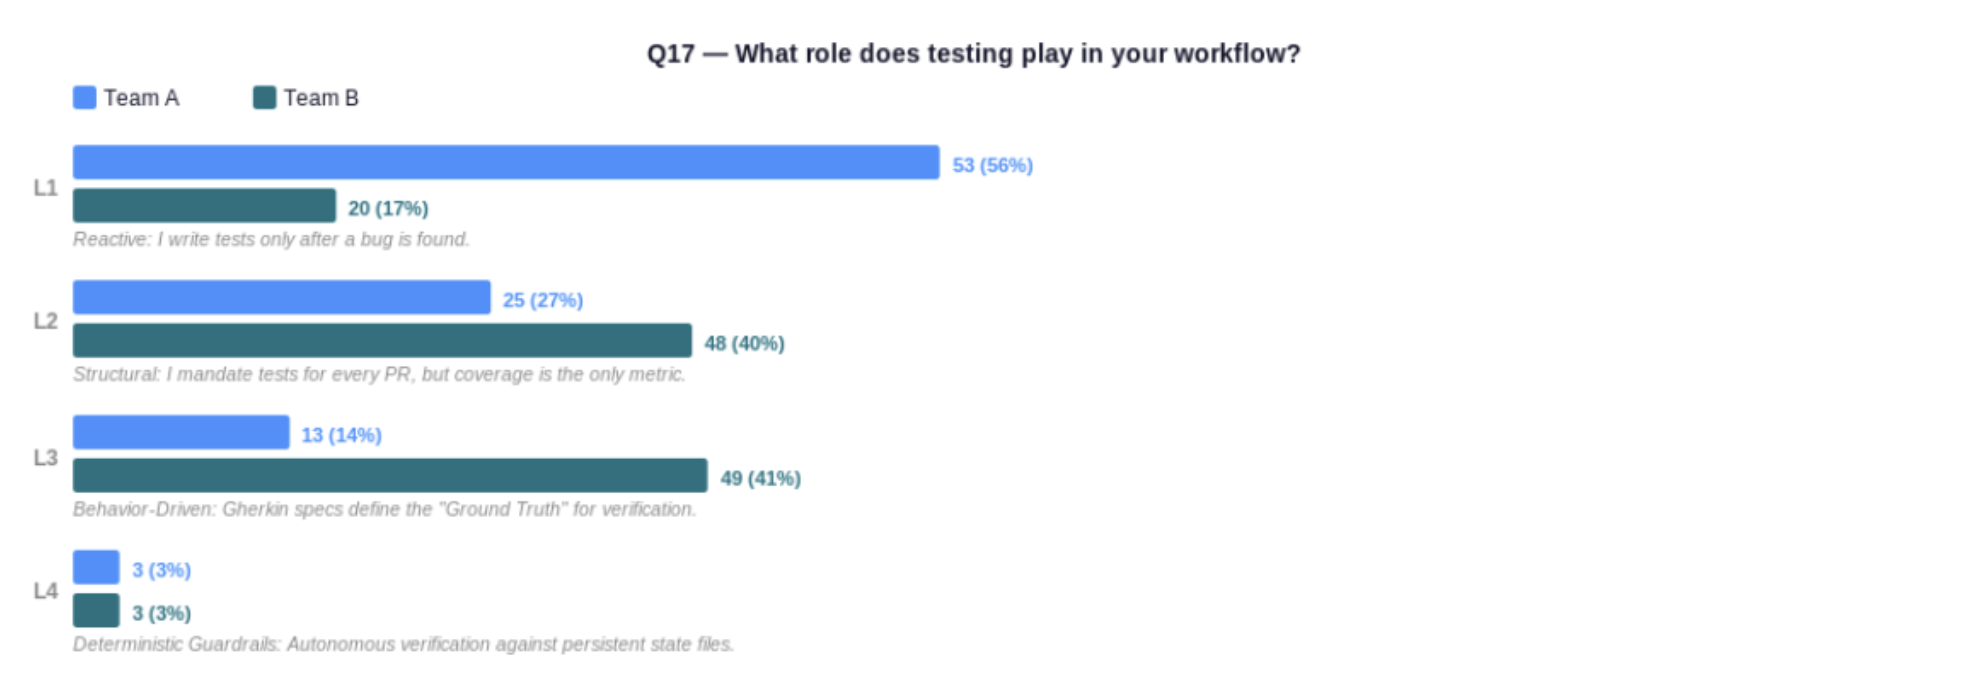
Team A (less mature) vs Team B (more mature). Q17 — What role does testing play in your workflow?
In Team A, 56% write tests only after a bug is found — a reactive posture that predates AI-assisted development and hasn’t kept pace with it. Team B has made the shift: only 17% remain reactive, with 41% using behaviour-driven approaches where Gherkin specs define the ground truth before code is written. As AI accelerates code generation, the discipline of pre-specifying quality criteria is what separates teams accumulating invisible debt from those that aren’t. The difference is structure and organisation, not tooling.
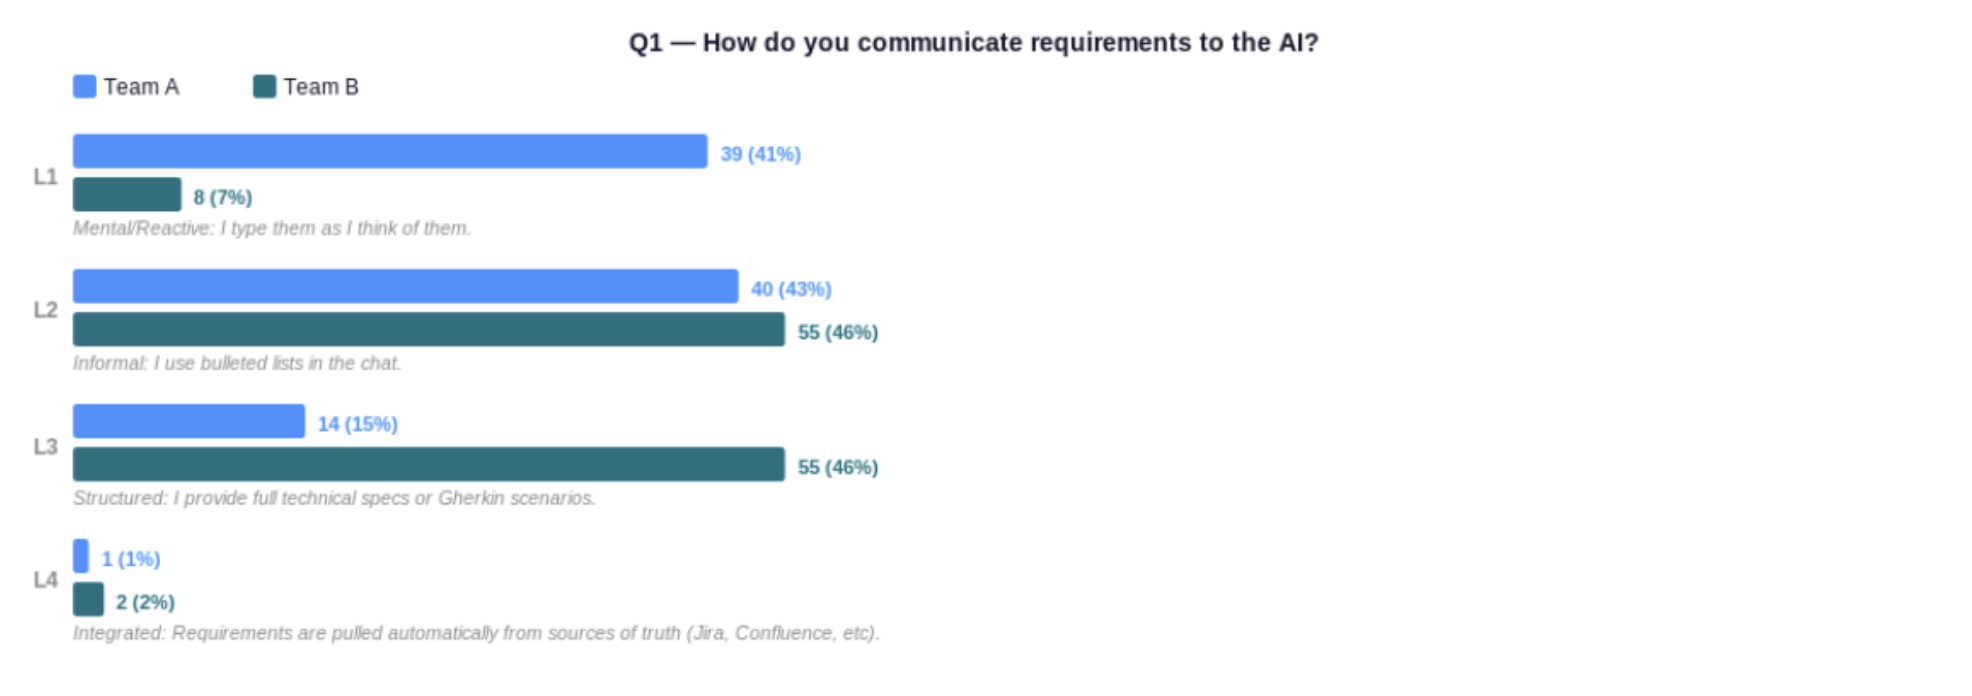
Team A (less mature) vs Team B (more mature). Q1 — How do you communicate requirements to the AI?
The gap here is the starkest. In Team A, 41% type requirements as they think of them, and only 15% provide structured specs. In Team B, just 7% remain reactive — 46% are providing full technical specs or Gherkin scenarios before touching the chat window. This is the widest per-question gap in the whole dataset. Top-performing teams average 2.36 on this question versus 1.79 in the bottom third. And it’s entirely addressable without new tools: structured requirements is a discipline, not a technology.
Scale & Integration
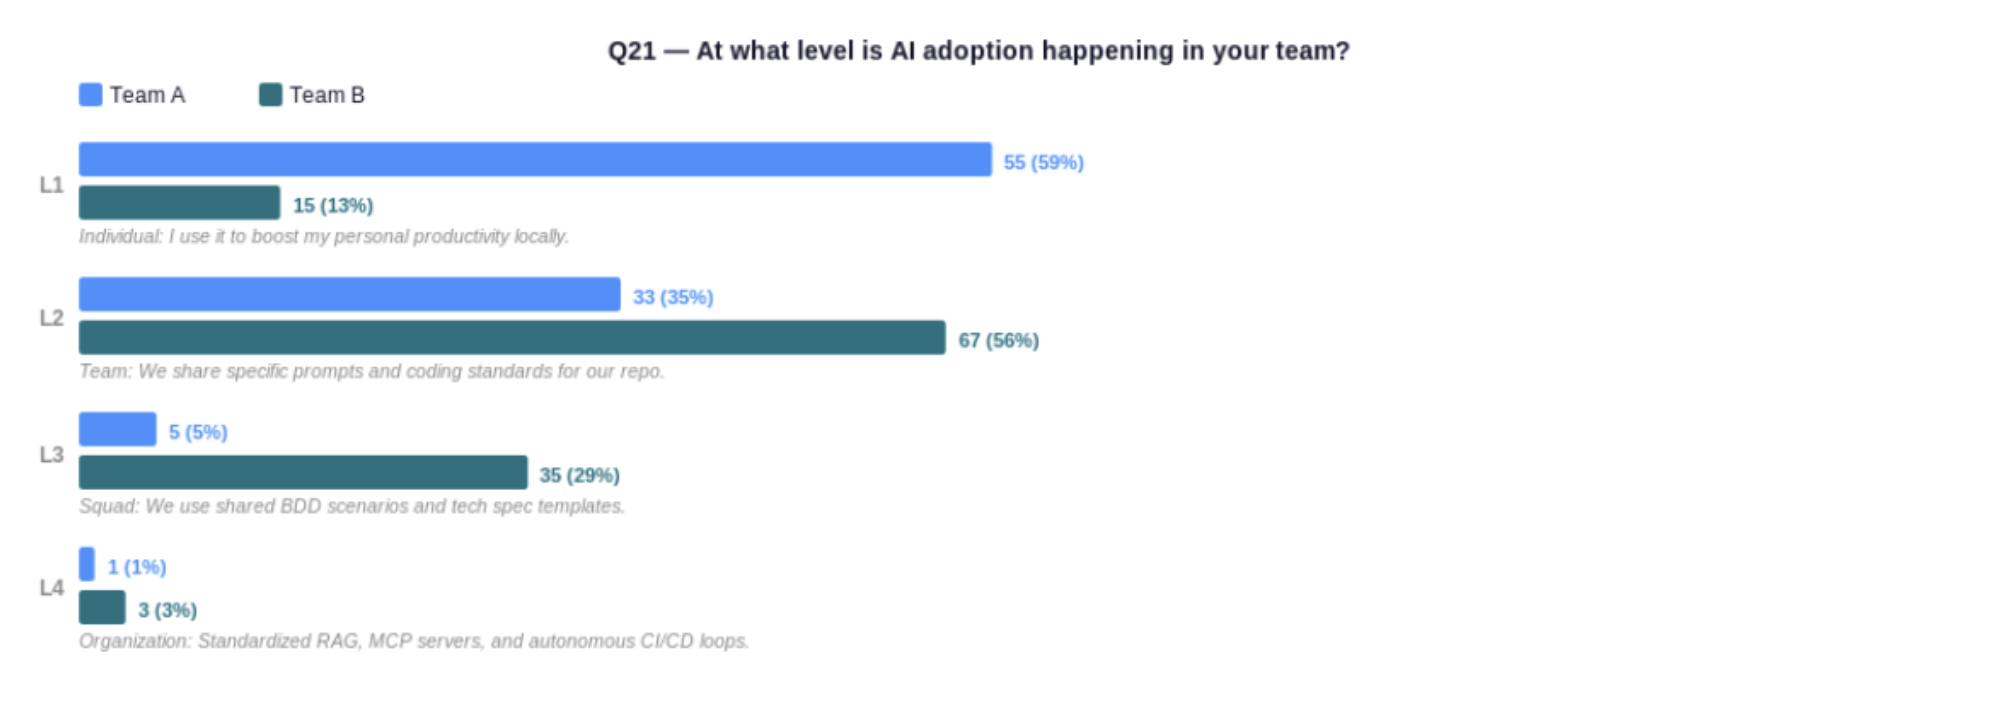
Team A (less mature) vs Team B (more mature). Q21 — At what level is AI adoption happening in your team?
In Team A, 59% describe their AI use as individual only — personal productivity with no shared infrastructure. In Team B, only 13% remain at individual level; 56% are sharing prompts and coding standards at team level, and 29% operate at squad level with shared BDD scenarios and tech spec templates. The tools are identical. What Team B has that Team A doesn’t is an institutional layer that makes individual capability compound. Without it, the best engineers in the organisation are islands.
The practices that separate the top 20% from the median — structured prompting, upfront test specification, explicit context-setting — are consistent across all five dimensions. None of them require new tools. All of them require deliberate habit change.
What comes next
Structure enablement around the data. Requirements communication and scale of adoption are the most consistent differentiators — and both are addressable through team-level standards rather than individual coaching.
Learn from the teams already doing it. The top-third teams are already demonstrating what works. Documenting those practices and creating pathways for others to adopt them is more tractable than broad training.
Understand the seniority effect — and design an experiment to test it. The hypothesis is that enabling senior engineers first will drive adoption across the teams they influence, not just help them catch up individually. A second AIMM run won’t test that — it’ll show whether scores improved, not why. A more useful design: run targeted senior-first enablement in a subset of teams over the next quarter and compare their maturity trajectory in the six-month reassessment against teams that received broad-cohort enablement. If the hypothesis holds, senior-first teams should show faster compression of the seniority gradient and higher overall maturity gain.
Rerun the assessment in six months. The first run establishes the baseline. The second will tell us whether the needle is moving, and in which dimensions.
What we know, after this assessment, is what adoption looks like at scale. What we don’t yet know is whether higher maturity translates to better business outcomes — that connection still needs to be established. But the finding about practice versus technology is already actionable. The gap between the median and the top 20% isn’t explained by tool access. It’s explained by how people use them.
Curious to hear whether any of this resonates — and whether your senior engineers are outperforming or underperforming your juniors.
About the assessment
The AI Engineering Maturity Model assessment takes around 15 minutes to complete. Engineers answer structured questions across five dimensions: Architecture & Context, Development Workflow, Verification & Quality, Scale & Integration, and Intent & Requirements. Responses are anonymised and aggregated at team level.
We ran the 1,309-person cohort through the same unmodified instrument, so scores are directly comparable to future runs. The most useful output isn’t the headline number — it’s the question-level data, showing which specific practices are missing and where the ceiling is being set.
*Exploratory factor analysis showed the 25 questions load cleanly onto the five intended dimensions (KMO = 0.968, 59.9% variance explained), and internal consistency is high across all dimensions (Cronbach’s α = 0.835–0.892).